from Leadership Medica n. 271/2008
ABSTRACT
Women with former gestational diabetes (fGDM) often show defects in both insulin sensitivity and beta cell function, but it is not completely clear whether one defect plays the major role or appears first. To assess insulin sensitivity and beta cell function in fGDM uncomplicated by obesity and hyperglycemia, in a first study we analyzed 24 lean fGDM women and 23 healthy control women (CNT) matched for age, body mass index, and indistinguishable for plasma glucose both at fasting and at 120 minutes. Insulin sensitivity and b-cell function indices were computed from an oral glucose tolerance test (OGTT): an insulin sensitivity index called OGIS, and indices of beta cell function obtained using a mathematical model. OGIS was not significantly different in the two groups (492.7±6.3 vs. 496.4±9.4 ml·min-1·m-2), whereas the beta cell glucose sensitivity obtained by modelling analysis was lower in fGDM (108±14 vs. 165±22 pmol·min‑1·m‑2·mM‑1, P=0.031). In a second study we expanded both the groups, and hence we analyzed 82 normotolerant fGDM, and 38 healthy control women. In this new study we analyzed the data from both an intravenous and an oral glucose tolerance tests (IVGTT, OGTT). Insulin sensitivity and beta cell function were assessed by both IVGTT and OGTT. Both tests revealed impaired insulin sensitivity already in the normotolerant group compared to controls (IVGTT: 4.2±0.3 vs. 5.4±0.4×10⁻⁴ min-1×(µU/ml)-1; OGTT: 440±7 vs. 472±9 ml×min-1×m-2). Conversely, no difference was found in beta cell function from IVGTT. However, some parameters of beta cell function by OGTT modeling analysis were found already impaired: glucose sensitivity (106±5 vs. 124±7 pmol×min-1×m-2×mM-1, P=0.0407) and insulin secretion at 5 mM glucose (168±9 vs. 206±10 pmol×min-1×m-2, P=0.003). We conclude that both insulin sensitivity and beta cell function are already impaired in a general normotolerant fGDM population, but if a specific fGDM group very similar to the healthy control group is selected, the insulin sensitivity is found normal, whereas the beta cell function seems to be already impaired. Thus, beta cell function impairment might be the primary defect in former gestational diabetes.
KEYWORDS
Insulin sensitivity, beta cell glucose sensitivity, insulin action, insulin release, insulin secretion, former gestational diabetes, diabetes risk, mathematical modelling.
INTRODUCTION
Women with a history of previous gestational diabetes are at risk for later development of Type 2 diabetes [1-3]. The risk is increased when the condition of former gestational diabetes (fGDM) is accompanied by other factors that predispose to diabetes also in different categories of subjects, like improper diet habits, sedentary lifestyle, obesity or weight gain [4, 5]. However, high glycemic levels during pregnancy or after delivery, both at fasting and during an oral glucose tolerance test (OGTT), probably remain the strongest predictors for diabetes development in women with fGDM [6, 7]. Nonetheless, it is not completely clear whether the history of gestational diabetes itself can be an independent risk factor for future diabetes.
To investigate the possible intrinsic abnormalities in women with fGDM independently of confounding factors such as obesity or hyperglycemia, we have selected a group of lean fGDM women with normal OGTT and a matched group of normal women.
FIRST STUDY: METHODS
In a first study, a group of 24 women with fGDM were studied together with 23 control (CNT) women, without any known risk for diabetes and with normal glucose tolerance during pregnancy. All women were Caucasian and studied 4‑6 months after delivery. At the time of the study, all the women had normal glucose tolerance. The fGDM and CNT subjects were group-matched for age, body mass index (BMI), fasting plasma glucose, and plasma glucose at 120 minutes (Table 1).
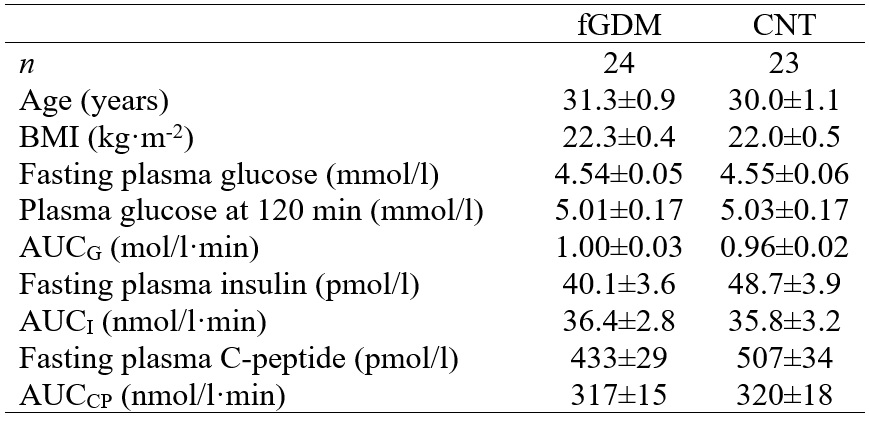 Table 1 Characteristics of former gestational diabetic (fGDM) and control (CNT) women. Data are
mean±SE.
After an overnight fast, all subjects underwent a standard 75 g OGTT. Venous blood samples for determination of plasma concentration of glucose, insulin and C-peptide were collected before glucose ingestion (fasting sample, t=0) and at 10, 20, 30, 60, 90, 120, 150 and 180 min afterwards.
Areas under the curve of plasma glucose, insulin and C-peptide concentration during the OGTT (AUCG, AUCI, AUCCP, respectively) were computed by trapezoidal integration. Insulin sensitivity was calculated from the OGTT with the oral glucose insulin sensitivity index (OGIS) [8].
Mathematical modelling was exploited to obtain more sophisticated parameters describing the b-cell secretory process [9, 10]. The model describes the relationship between insulin secretion (pmol·min-1·m-2) and glucose concentration and is coupled with a model of C-peptide kinetics [11]. A block diagram of the model is reported in Figure 1.
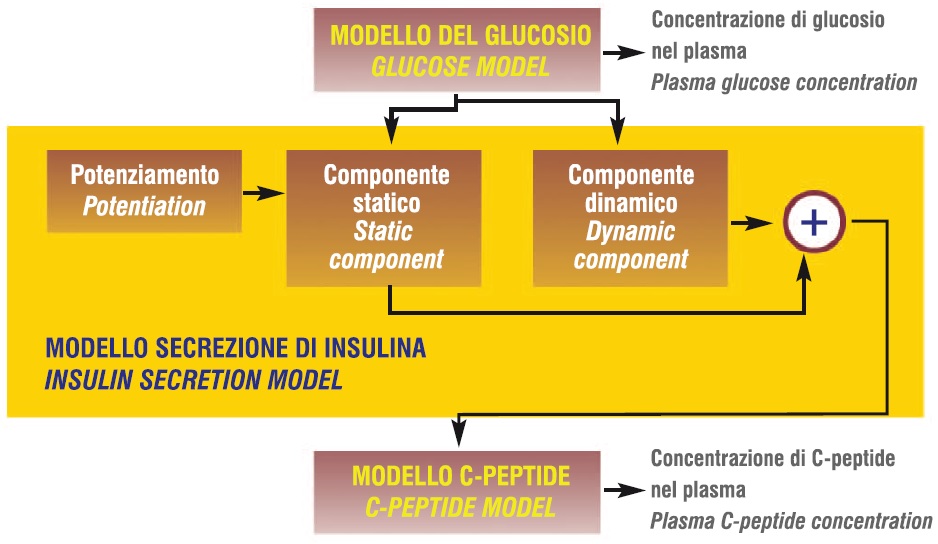 Figure 1 Block diagram of the mathematical model for assessment of beta cell function
In short, the insulin secretion is the sum of two components; namely, Sg(t) and Sd(t). The first component, Sg(t), represents the dependence of insulin secretion on absolute glucose concentration (G) at any time point, and is characterized by a dose-response function, f(G). The dose-response f(G) is a curvilinear function, although its slope changes only minimally in the observed glucose range (~5-7 mmol/l). The mean value of the dose-response slope is calculated as its integral mean in the 5-7 mmol/l glucose range. This is a b-cell function parameter denoted as glucose sensitivity. The dose-response is modulated by a time-dependent potentiation factor, P(t); thus, Sg(t)=P(t)f(G). A characteristic parameter of P(t) is its mean time, computed as the integral over the OGTT period of the product between time and P(t), divided by the integral of P(t) in the same period [9]. The second insulin secretion component, Sd(t), represents a dynamic dependence of insulin secretion on the rate of change of glucose concentration and is termed derivative component. Sd(t) is proportional to the glucose time derivative (for a positive derivative, otherwise Sd(t)=0); the proportionality constant is termed rate sensitivity.
Data and results are given as mean±SE. Statistical significance of difference in parameter mean value between the groups was assessed with the unpaired t test. Multiple regression analysis was performed among glucose sensitivity, OGIS, and AUCG. P<0.05 was considered statistically significant.
FIRST STUDY: RESULTS
Plasma concentrations of glucose, insulin and C-peptide during the OGTT were not different in fGDM and CNT according to the conventional OGTT analysis, except for plasma glucose at 60 min that was ~1 mmol/l higher in fGDM (P=0.047). As a consequence, AUCs were also very similar (Table 1).
Insulin sensitivity from the OGTT (OGIS) was not different in the two groups (Table 2).
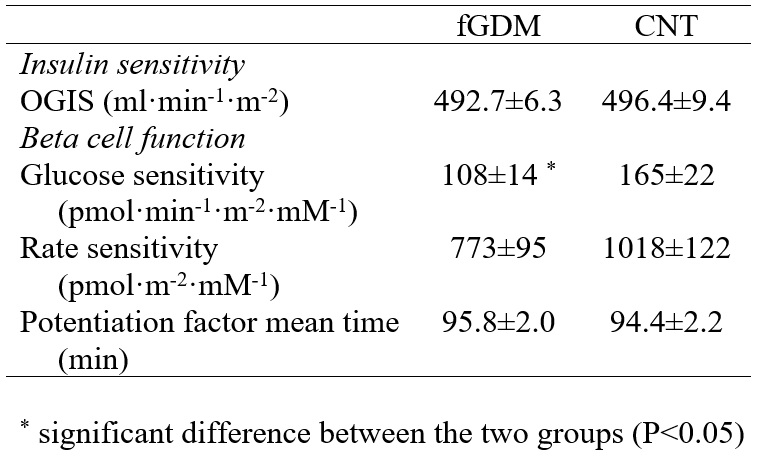 Table 2 Indices of insulin sensitivity and ß-cell function in former gestational diabetic (fGDM) and control
(CNT) women.
From model analysis, the rate sensitivity and the potentiation factor mean time were not different in the two groups. However, glucose sensitivity (Table 2) was significantly lower in fGDM (P=0.031). The difference in glucose sensitivity (i.e. mean slope of dose-response function) is shown in the representation of the dose-response curves (Figure 2).
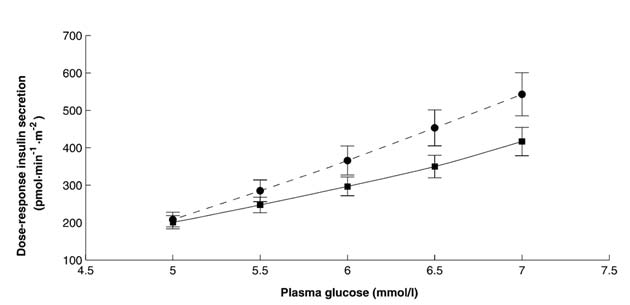 Figure 2 Dose-response curve of glucose-induced insulin secretion during the oral glucose tolerance
test in 24 former gestational diabetic women (solid line) and 23 control women (dashed line).
In spite of the narrow range in glucose tolerance, as expressed by AUCG (Table 1), a significant part of this variability in the whole cohort was explained by both insulin sensitivity (OGIS) and glucose sensitivity (R2=0.35, P<0.0001; multiple regression). Thus, both these parameters play a role in determining the variations in AUCG that occur within the range of normal glucose tolerance.
IN PROGRESS STUDY: METHODS
In the new study the group of the normotolerant fGDM subjects was expanded to 82 patients, and the group of CNT subjects was expanded to 38 healthy subjects. These subjects were studied not only through the OGTT, but also through an intravenous glucose tolerance test (IVGTT). Glucose was injected at time 0-0.5 min (300 mg/kg) and insulin (0.03 IU/kg) was infused intravenously at time 20 for 5 min. Venous blood samples for determination of plasma concentration of glucose, insulin and C-peptide were collected at fasting and at 3, 4, 5, 6, 8, 10, 14, 19, 22, 27, 30, 35, 40, 50, 70, 100, 140, 180 minutes after glucose infusion. Insulin sensitivity was estimated by Minimal Model analysis from the IVGTT (parameter SI) [12]. As regards beta cell function, a widely accepted index from the IVGTT is the acute insulin response (AIR) in the first minutes following glucose stimulation [13] which was computed as the suprabasal integral of plasma insulin in the 0-8 minutes interval normalized to the interval length. As regards the OGTT, in this second study we derived another beta cell function parameter from the already presented model. In fact, the value of the dose-response function at a prescribed glucose level can be considered another parameter of beta cell function. Typically, 5 mM glucose level is considered in nondiabetic populations, and the parameter is denoted as ISR5. Furthermore, instead of the potentiation factor mean time, here we considered the ratio of the potentiation factor at 180 to that at zero minutes, which is denoted as PFR. All the other methodological aspects of this second study remained similar to those already described before.
IN PROGRESS STUDY: RESULTS
In this second study, in the CNT group mean glucose was lower than in fGDM in both the OGTT and the IVGTT (Table 3).
![Andrea Tura - Endocrinologia - Diabete gestazionale Tabella 3 Età, Indice di Massa Corporea [BMI] e livelli di glucosio in donne affette da pregresso diabete gestazionale (soggetti fDGM) e donne di controllo (CNT). Andrea Tura - Endocrinologia - Diabete gestazionale Tabella 3 Età, Indice di Massa Corporea [BMI] e livelli di glucosio in donne affette da pregresso diabete gestazionale (soggetti fDGM) e donne di controllo (CNT).](/images/med/Tura/tabella3b.jpg) Table 3 Age, BMI, and glucose levels in former gestational diabetic (fGDM) and control (CNT) women.
Table 3 Age, BMI, and glucose levels in former gestational diabetic (fGDM) and control (CNT) women.
In the OGTT, the glucose sample showing the highest difference between fGDM and CNT was again that at 60 min (7.9±0.2 vs. 6.3±0.2 mmol/l, respectively, P<0.0001). Also fasting glycaemia was lower in fGDM than in NGT. Conversely, mean values of insulin and C-peptide during the IVGTT and the OGTT were not different among the two groups (not shown).
 Figure 3 Dose-response curve of glucose-induced insulin secretion during the oral glucose tolerance
test in 82 former gestational diabetic women (solid line) and 38 control women (dashed line)..
Insulin sensitivity is reported in Table 4. OGIS in CNT was higher than in fGDM. Similar results were found for SI. As regards beta cell function, the acute insulin response from the IVGTT (AIR) was not significantly different in fGDM and CNT (P=0.19). Conversely, glucose sensitivity from the OGTT was already slightly impaired in fGDM compared to CNT (P=0.0407). Furthermore, also ISR5 was lower in fGDM than in CNT (P=0.003). Therefore, the beta cell dose-response was shifted down and rightwards as glucose tolerance worsened (Figure 3).
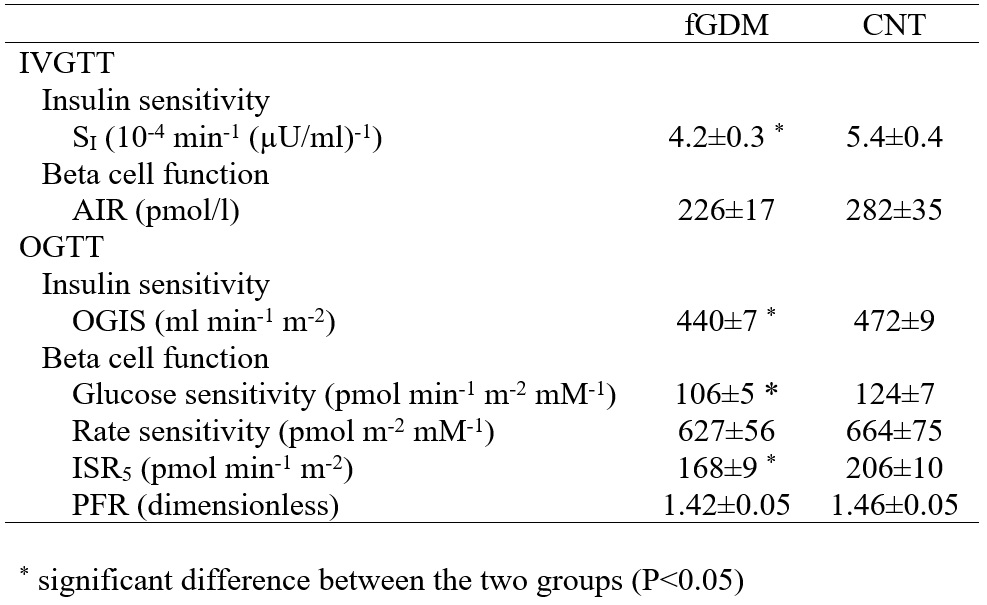 Table 4 Indices of insulin sensitivity and -cell function from both IVGTT and OGTT in former gestational
diabetic (fGDM) and control (CNT) women.
CONCLUSIONS
The first study showed that when a normotolerant former gestational diabetic group is compared to a healthy control group with similar age, BMI and, especially, glucose levels, no difference is found in insulin sensitivity, whereas some parameters of beta cell function (glucose sensitivity in that case) already shows some impairment. When a more general normotolerant former gestational diabetic group, not strictly matched to the control group for the above-mentioned characteristics, is considered, both insulin sensitivity and beta cell function (at least some parameters) seems to be impaired. That may confirm the hypothesis that former gestational diabetes is related to both insulin sensitivity and beta cell function defects, but the primary defect seems to be the latter, as it is already found in a population very similar to the control group and with no evidence of insulin sensitivity impairment. It must also be noted that OGTT test seems to be more adequate to detect subtle defect in beta cell function than the IVGTT, as the beta cell function parameter derived from it (AIR) was not different between the former gestational diabetic and control groups, whereas some of the OGTT-derived parameters were..
Andrea Tura
Unità Metabolica, Istituto di Ingegneria Biomedica, CNR, Padova, Italia
BIBLIOGRAFIA
- Damm P, Kühl C, Bertelsen A, Mølsted-Pedersen L. Predictive factors for the development of diabetes in women with previous gestational diabetes mellitus. Am J Obstet Gynecol 1992;167:607-16.
- Metzger BE, Cho NH, Roston SM, Radvany R. Prepregnancy weight and antepartum insulin secretion predict glucose tolerance five years after gestational diabetes mellitus. Diabetes Care 1993;16:1598-605.
- Buchanan TA, Xiang A, Kjos SL, Lee WP, Trigo E, Nader I et al. Gestational diabetes: antepartum characteristics that predict postpartum glucose intolerance and Type 2 diabetes in Latino women. Diabetes 1998;47:1302-10.
- Kim C, Newton KM, Knopp RH. Gestational diabetes and the incidence of Type 2 diabetes: a systematic review. Diabetes Care 2002;25:1862-8.
- Pendergrass M, Fazioni E, De Fronzo RA. Non-insulin-dependent diabetes mellitus and gestational diabetes mellitus: same disease, another name? Diabetes Rev 1995;3:566-83.
- Kjos SL, Buchanan TA, Greenspoon JS, Montoro M, Bernstein GS, Mestman JH. Gestational diabetes mellitus: the prevalence of glucose intolerance and diabetes mellitus in the first two months post partum. Am J Obstet Gynecol 1990;163:93-8.
- Kjos SL, Peters RK, Xiang A, Henry OA, Montoro M, Buchanan TA. Predicting future diabetes in Latino women with gestational diabetes. Utility of early postpartum glucose tolerance testing. Diabetes 1995;44:586-91.
- Mari A, Pacini G, Murphy E, Ludvik B, Nolan JJ. A model-based method for assessing insulin sensitivity from the oral glucose tolerance test. Diabetes Care 2001;24:539-48.
- Mari A, Tura A, Toschi E, Gastaldelli A, Camastra S, Ferrannini E. Assessing insulin secretion by modeling multiple meal tests: role of potentiation. Diabetes 2002;51:S221-6.
- Mari A, Schmitz O, Gastaldelli A, Oestergaard T, Nyholm B, Ferrannini E. Meal and oral glucose tests for assessment of beta -cell function: modeling analysis in normal subjects. Am J Physiol Endocrinol Metab 2002;283:E1159-66.
- Van Cauter E, Mestrez F, Sturis J, Polonsky KS. Estimation of insulin secretion rates from C-peptide levels. Comparison of individual and standard kinetic parameters for C-peptide clearance. Diabetes 1992;41:368-77.
- Pacini G, Tonolo G, Sambataro M, Maioli M, Ciccarese M, Brocco E, Avogaro A, Nosadini R. Insulin sensitivity and glucose effectiveness: minimal model analysis of regular and insulin-modified FSIGT. Am J Physiol Endocrinol Metab 1998;274:E592-E599.
- Johnston C, Raghu P, McCulloch DK, Beard JC, Ward WK, Klaff LJ, McKnight B, Bergman RN, Palmer JP. Beta-cell function and insulin sensitivity in nondiabetic HLA-identical siblings of insulin-dependent diabetics. Diabetes 1987;36:829-837.


